Five AI metrics I would remove from an executive dashboard
Licenses, prompts, pilots, hours saved and benchmark scores can all rise while the business stands still. The executive dashboard needs a different contract.
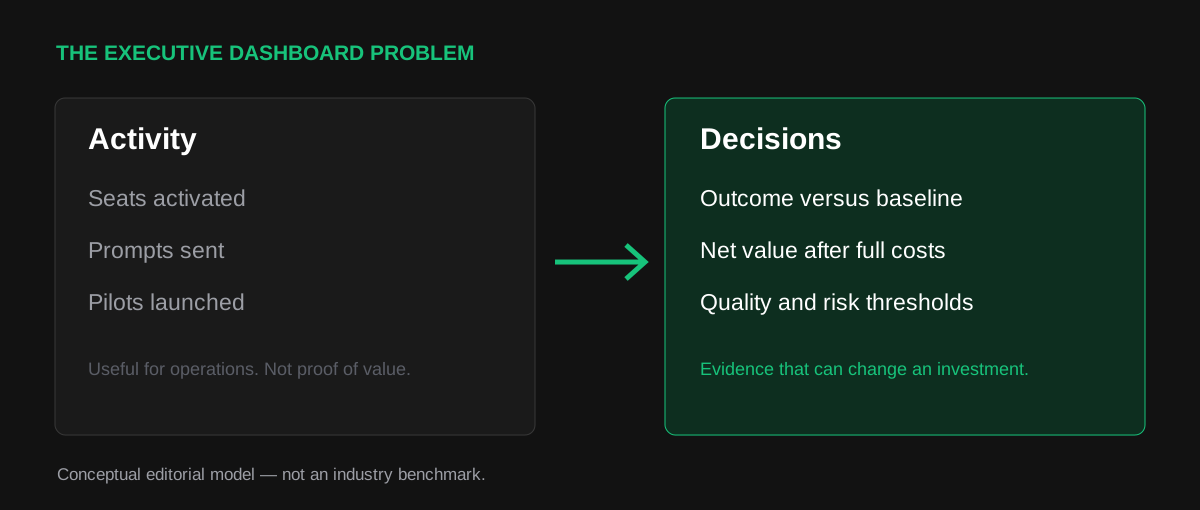
The problem is not that the numbers are wrong. It is that a dashboard can report a great deal of AI activity without helping anyone decide what deserves another dollar.
Imagine the slide that opens a quarterly AI steering committee. The number of licensed employees has climbed. Usage is up. More pilots have gone live. The latest model has beaten its previous benchmark, and an estimate of hours saved sits in a green box at the bottom. Nothing on the slide is necessarily false. Yet the person approving next quarter's budget still cannot tell whether to expand the program, change its direction or close an expensive part of it.
This is the peculiar comfort of an activity dashboard. It turns uncertainty into neat columns while leaving the important decision untouched. The problem is older than generative AI, but AI has made it easier to generate impressive-looking activity at scale.
I would take five popular measures off the executive headline. I would not delete them from operational monitoring, engineering or evaluation. A platform team needs to know who has access; an engineer needs to know how the model performs. The distinction is about the question a measure is allowed to answer. A number belongs on the executive dashboard when a change in that number could rationally change a business decision.
1. Licenses activated: access is not a changed business
A rising seat count can tell procurement that rollout is progressing. It can help security identify the population with access. But it cannot establish whether anyone is doing better work, whether the work matters or whether the company is getting a return.
A 2026 paper using the US Census Bureau's Business Trends and Outlook Survey makes the distinction unusually clear. The authors separate AI adoption by firm, by business function and by worker task. During the study's November 2025–January 2026 window, 18% of firms reported AI use in at least one function; among firms using it, 57% reported use in three or fewer functions.1 These are survey-based diffusion estimates, not a measure of value creation. They show why a single adoption headline can conceal a narrow footprint.
What I would put in its place: the proportion of a specific, eligible business workflow completed to an agreed quality standard, and the outcome that workflow is meant to improve. A legal team might track the share of reviewed contracts completed within a service window without increasing material omissions. An operations team might track correctly resolved cases per paid hour. Both measures require definitions of eligible cases and quality; neither can be inferred from licenses alone.
Seats still matter. They just belong to the rollout operator, not as a substitute for the investment result.
2. Prompts sent or weekly active users: activity can rise as the experience deteriorates
Usage is ambiguous. A customer-support agent who needs ten prompts to repair an inadequate answer may appear more engaged than one who gets a usable result in two. An employee who has to check and rewrite every draft may be counted as an enthusiastic user. And a person who has stopped using the tool because it is unreliable will disappear from the numerator without revealing why.
That does not make usage telemetry useless. A collapse in use can be an early warning, and repeated use may signal that a tool has found a place in someone's work. It does make usage a weak stand-in for effectiveness.
What I would put in its place: the rate of accepted outcomes per eligible case, with the cost of corrections, rework and escalation visible alongside it. For an internal research assistant, the question is not how often people ask. It is how often a result is accepted after appropriate review, how much checking it requires and whether it improves the downstream decision.
There is a necessary caveat: low use is not always bad. A tool intended for rare, high-stakes exceptions should not be judged by the same activity threshold as a daily writing assistant. The denominator must reflect the work, not the vendor's engagement dashboard.
3. Hours saved: the most persuasive number is often the least bankable
This is the number I would challenge most carefully, precisely because the underlying benefit can be real.
In a randomized field experiment spanning 66 firms and 7,137 knowledge workers, people who used an integrated generative AI assistant spent about two fewer hours a week on email in the later part of the study. The researchers did not detect a corresponding shift in the quantity or composition of tasks from individual-level access.2 The first finding is a meaningful change in working patterns; the second limits what it proves about organizational outcomes. Some authors were affiliated with the product maker, a disclosure worth retaining alongside the experimental design.
A saved hour is a unit of capacity, not automatically a unit of financial return. If nobody changes staffing, overtime, throughput, customer response times or the backlog that matters, multiplying the hour by a salary rate produces a capacity equivalent—not necessarily cash.
What I would put in its place: the captured consequence of the freed capacity. Did a team clear more qualified cases without increasing errors? Did it avoid contractor spend? Did customers wait less? Did employees work fewer evenings, which may be a worthwhile outcome even when it does not improve this quarter's profit? Specify the intended benefit before the test. Do not retroactively label every pleasant side effect a return on investment.
This is related to my ten-minute business-case test, which asks how a unit of improved work becomes capturable value. Here the concern is what happens later, when that unverified unit is promoted into a recurring executive KPI.
4. The model's benchmark score: a test result is not a service result
A model may improve on a benchmark while the deployed workflow becomes more expensive or less dependable. The system that employees encounter includes prompts, retrieved data, tools, routing, fallback behavior, review and escalation. A better model score does not guarantee that the full system makes fewer consequential mistakes.
The customer-support evidence is instructive. In a study of 5,179 agents, access to an AI assistant increased issues resolved per hour by about 14% on average, with larger gains among less experienced workers.3 This is an observed operational result in a specific setting, not a universal promise about AI tools. It is also a more relevant unit than the model's standalone score because it measures what people actually delivered.
What I would put in its place: end-to-end performance on representative live work, segmented by case type and evaluated against explicit quality and risk thresholds. Track the cases the system refuses, the cases it sends for human review, the cases it gets wrong and the work needed to recover. A mean score can conceal an unacceptable failure in a small but important segment.
Technical benchmarks remain indispensable for model selection and regression testing. They are evidence for engineers and evaluators. An executive should see them when they explain a business decision or a safety constraint, not because a higher score looks like progress.
5. Pilots launched: a growing portfolio may be an expanding queue of unfinished decisions
A count of pilots is a count of experiments begun. It is not a count of uncertainties resolved. A company can celebrate twelve new use cases while none has a named operating owner, an agreed stop condition or a credible plan for the second team to take over.
I would rather see three pilots close with honest conclusions than twelve continue because ending one would spoil the quarterly presentation. The closed pilot might establish that the model is not accurate enough, that a process change beats AI, or that the economics collapse after supervision. All three can be useful results if they prevent a larger mistake.
What I would put in its place: the number of investment decisions resolved with adequate evidence: scale, redesign, defer or stop. Include the amount of spend or exposure those decisions redirected. A stopped pilot should count as progress when it retires a material uncertainty before further investment. A pilot that merely stays alive should not.
That measure needs safeguards of its own. If teams are rewarded for the number of decisions closed, they may rush them. Require a recorded hypothesis, a comparison, the decision owner and a reviewable explanation. The objective is better capital allocation, not faster paperwork.
The replacement dashboard should fit on one page
These five measures do not need five new executive scorecards. They need a single, stricter reporting discipline.
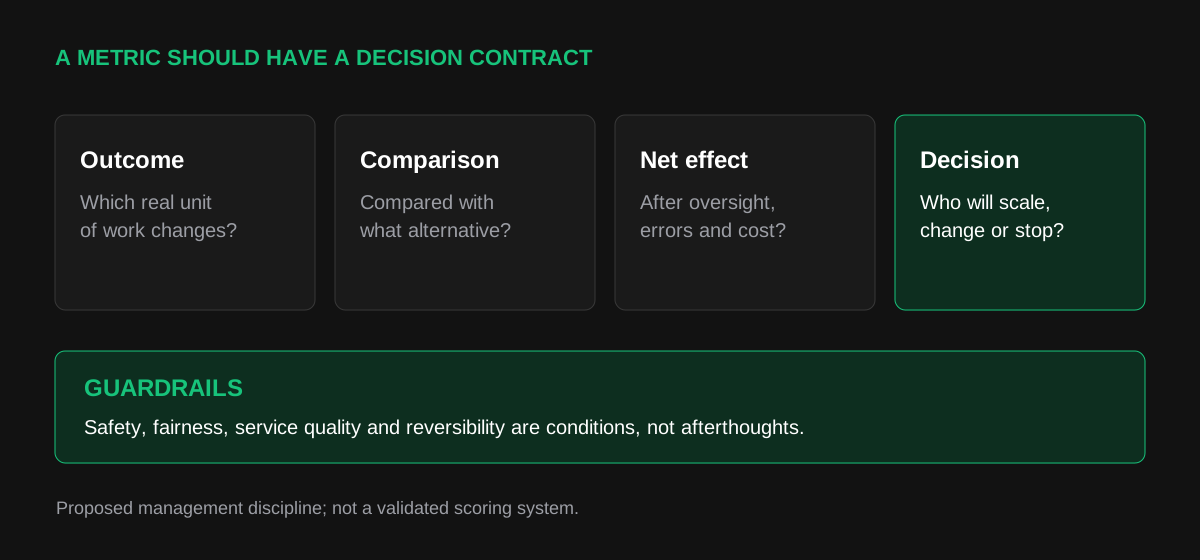
For each material AI investment, I would ask for a short decision contract. Name the business outcome and the unit being changed. State the comparison: what would plausibly happen without this intervention, or with a simpler alternative? Show the net effect after integration, monitoring, human review, corrections and vendor costs. Finally, name the person authorized to scale, redesign or stop the investment, and the threshold that would cause that decision.
The UK's 2026 guidance on impact evaluation of AI interventions distinguishes technical performance from impact, calls for an explicit theory of change and baseline, and recommends credible comparison methods where appropriate.4 It was written for public-sector interventions, not corporate board reporting. The transferable discipline is to decide how you will know before announcing that you know.
A useful test for any executive AI metric
If the number improves next month, what would you do differently? If it deteriorates, what would you stop, investigate or change? If the answer to both is “nothing,” it may be a useful diagnostic—but it is not yet an executive decision metric.
An illustrative service operation could report that AI-assisted cases have a higher accepted-resolution rate than a comparable non-AI group, while correction time and repeat contacts remain below agreed limits. It could then show the net cost per durable resolution and a decision to expand only to the case types for which the result holds. That is not a claim about an actual company. It is what a decision-ready report might look like.
The comparison matters. A before-and-after improvement may reflect staffing, demand mix or a new policy rather than AI. Randomized or staggered rollouts can sometimes make the estimate more credible; in other cases, careful observational analysis and transparent uncertainty are the best available option. A dashboard should reveal that difference rather than hide it behind a single percentage.
The objection: executives still need leading indicators
They do. Waiting for audited financial outcomes before making any decision would be irresponsible in a fast-moving program. Adoption, usage, benchmark quality and pilot velocity can all serve as leading indicators. Some outcomes take quarters to materialize, and a control measure can deserve attention even if it never produces revenue.
But a leading indicator is only useful when its relationship to a later result is explicit and regularly tested. If higher usage ceases to predict accepted work, stop treating usage as a success signal. If a benchmark improves while exception rates rise, the benchmark is not telling the whole operating story. If more pilots are launched than the organization can close, portfolio growth is becoming a liability.
The 2025 DORA research on software development argues that AI can amplify existing organizational strengths and weaknesses.5 Its findings concern software teams; they should not be presented as universal evidence for every industry. They do, however, make a useful warning visible: a system can become more productive at generating work while the organization's ability to deliver dependable outcomes remains constrained.
I would keep an operational dashboard rich in leading indicators, a risk dashboard alert to failure and a much smaller executive dashboard accountable to outcomes. The mistake is not collecting the numbers. It is asking them to answer questions they were never designed to answer.
The number that would make me most uncomfortable
At the next quarterly review, imagine removing the five green tiles and leaving an empty space headed Decisions changed by evidence. It might be blank. That would be an uncomfortable but informative finding. It would mean the program knows a great deal about what it has installed and very little about what the business should do next.
I would rather defend a dashboard with two credible outcomes and one well-evidenced decision to stop than a dashboard crowded with evidence of activity. The first might support a difficult investment choice. The second may simply make that choice easier to postpone.
Sources and evidence notes
Footnotes
-
Kathryn Bonney and colleagues, The Microstructure of AI Diffusion: Evidence from Firms, Business Functions, and Worker Tasks, NBER Working Paper 35141, April 2026. Nationally representative US business survey data; adoption is not impact. ↩
-
Eleanor W. Dillon, Sonia Jaffe, Nicole Immorlica and Christopher T. Stanton, Shifting Work Patterns with Generative AI, NBER Working Paper 33795, May 2025, revised November 2025. Randomized six-month field experiment across 66 firms and 7,137 workers. Email-time estimate pertains to tool users in the latter half. Microsoft affiliations disclosed in the paper. ↩
-
Erik Brynjolfsson, Danielle Li and Lindsey R. Raymond, Generative AI at Work, NBER Working Paper 31161 (2023), published in Quarterly Journal of Economics (2025). Staggered customer-support deployment; observed outcomes are setting-specific. ↩
-
HM Treasury / UK Evaluation Task Force, Guidance on the Impact Evaluation of AI Interventions, updated 15 May 2026. Public-sector evaluation guidance; corporate application here is Berk's synthesis. ↩
-
Google Cloud DORA, State of AI-assisted Software Development 2025. Software-development research, not a cross-sector causal estimate. ↩